Setup for IQ visualisation and digital signal processing
2026-10-05
Introduction
This guide explains how to set up your computer to use an SDRplay device to visualise IQ data. While this ideally requires advanced software like GNU Radio, I have also built a simple plugin for SDRconnect for those wanting a quick feel of what is possible without a steep learning curve.
To use an SDRplay RSP device with GNU Radio, you need both the SDRplay API (the hardware driver) and a bridge for GNU Radio to communicate with it. Using Radioconda is the highly recommended “easy path” because it pre-packages GNU Radio with the necessary SoapySDR support.
Choose your path:
The Full Setup: Follow the step-by-step guidelines below for GNU Radio.
The Quick Start: If you want a simpler way to view IQ constellation plots, skip straight to the Simple IQ Visualisation Plugin for SDRconnect section.
Step-by-Step Installation Guidelines
The easiest setup process involves installing the hardware driver first, followed by the software environment.
1. Install the SDRplay API
Regardless of which software you use, you must install the official hardware driver first so your computer can recognise the device.
- Go to the SDRplay Downloads page.
- Download and install the API for your platform (version 3.15 is current).
- Windows users: Ensure the installer completes and, if prompted, restart your computer.
2. Install Radioconda
Radioconda is a distribution that includes GNU Radio and almost all common SDR drivers pre-configured.
- Download the latest installer from the Radioconda GitHub.
- Run the installer according to the ReadMe on the Radioconda GitHub page. This generally involves double-clicking the .exe (Windows) or running the bash shell script (Linux) to set up a complete GNU Radio environment without manual compilation.
- If you are using hardware other than an SDRplay, refer to the Radioconda ReadMe page for further guidelines.
3. Connect GNU Radio to your SDRplay
Once both are installed, you can use the device in GNU Radio Companion (GRC):
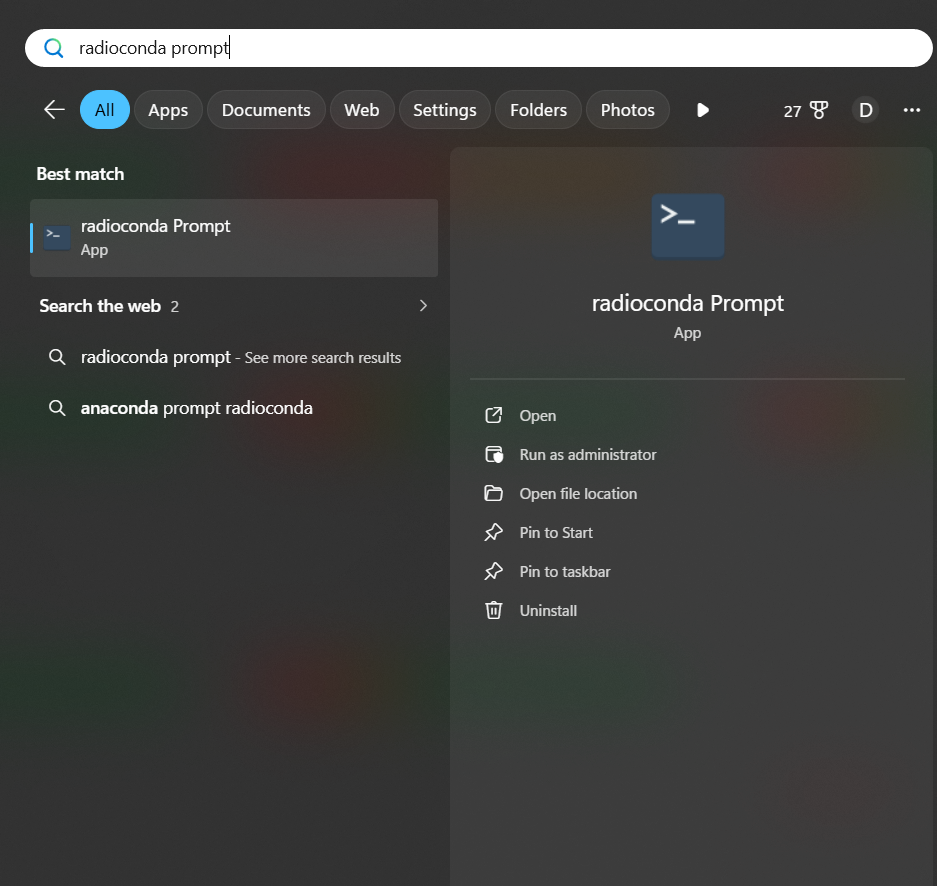
Launch Radioconda; Windows users can do this by launching the Radioconda App from the Start Menu.
Verify the connection using the
SoapySDRUtil --findcommand. If everything installed correctly and your SDRplay is connected via USB, you should see your device identified:
> SoapySDRUtil --find

######################################################
##     Soapy SDR -- the SDR abstraction library     ##
######################################################

Found device 16
  driver = sdrplay
  label = SDRplay Dev0 UNKNOWN 24020E2670
  serial = 24020E2670
Tip for Linux Users: If the command above fails to find your device, use
lsusbto verify that the OS sees the hardware. If it appears inlsusbbut not in Soapy, you likely need to manually trigger the SDRplayudevrules or restart the API service withsudo systemctl restart sdrplay.
- Launch GRC: type
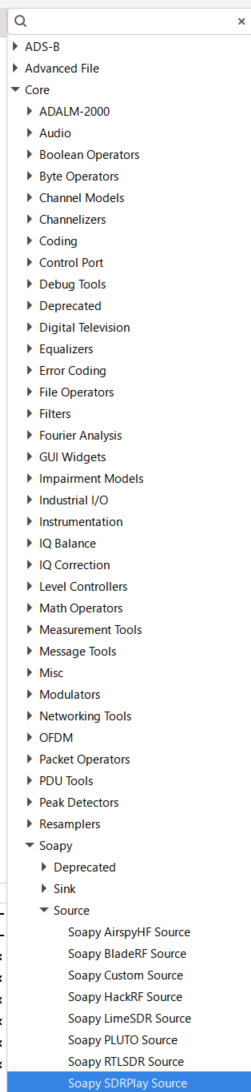
gnuradio-companionin the Radioconda shell to open the GUI. - Search for a Soapy Source Block in the block list on the right-hand side; it should be under
Core -> Soapy -> Source -> SoapySDRPlaySource.
You are now ready to use GNU Radio to process the IQ output of your SDR receiver. The learning curve can be steep, so I recommend checking out the GNU Radio wiki. To get you started, I have included several sample flowgraphs in my repository for you to modify and explore. If you have questions, feel free to email me.
Sample FlowGraphs
These flowgraphs are provided “as-is” in the following Git repository: [INSERT_FLOWGRAPH_REPO_URL_HERE]. Many allow you to capture raw IQ to a file, which can then be processed with the included Python scripts to create high-quality density plots.
Simple IQ Visualisation Plugin for SDRconnect
If you prefer not to install the dependencies above and just want to view IQ plots using standard SDR software, options are limited. Most standard software does not include constellation plots by default.
To solve this, I wrote a Python app that works with SDRconnect. It uses the WebSocket API (available in version 1.08+) to capture and plot IQ data in real-time.
Installation instructions for SDRconnect and IQ module
1. Download SDRconnect
- Download SDRconnect for Windows, MacOS, or Linux. Ensure you are using at least version 1.08.
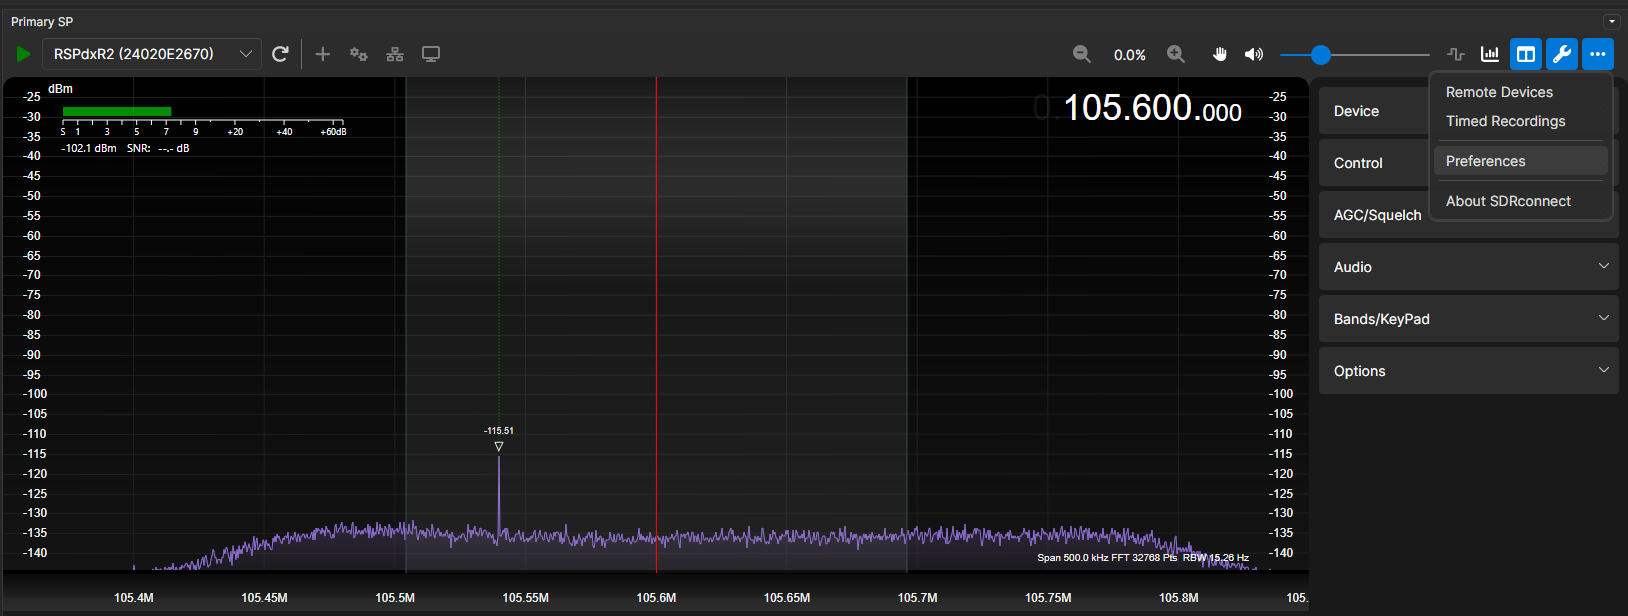
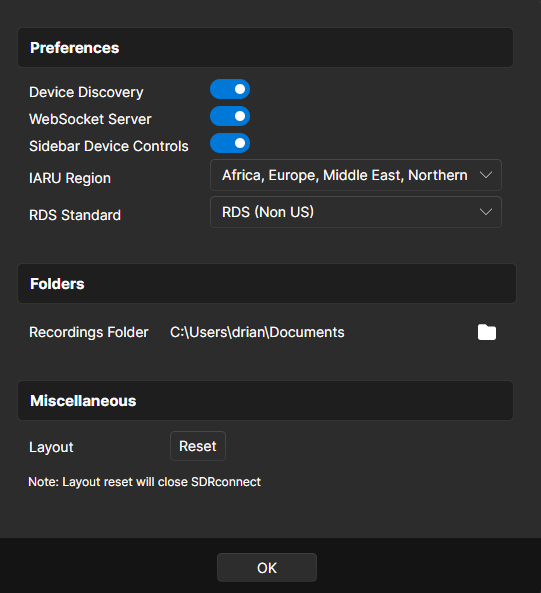
- Once installed, enable the WebSocket Server: click the three dots (top right) -> Preferences -> Enable WebSocket Server.
2. Install the Python IQ Module
- Download my script from [https://github.com/IanHenry/sdrconnect-iq-visualiser] and run
python sdrConnectIQvisualiser.py. It does not need to be in the SDRconnect directory as it communicates via the network API. - Windows users: A pre-compiled .exe version is also available at [https://github.com/IanHenry/sdrconnect-iq-visualiser/releases/] for a standalone launch.
Using the Simple IQ Visualisation Plugin
This tool is designed for visualising strong signals like Broadcast FM/AM, Repeaters, and Airband. It uses the sampled window centered on the waterfall. While audio filters are applied in SDRconnect, they do not affect this raw IQ stream. The script automatically periodically re-centers the VFO so the IQ you see matches your tuned frequency.
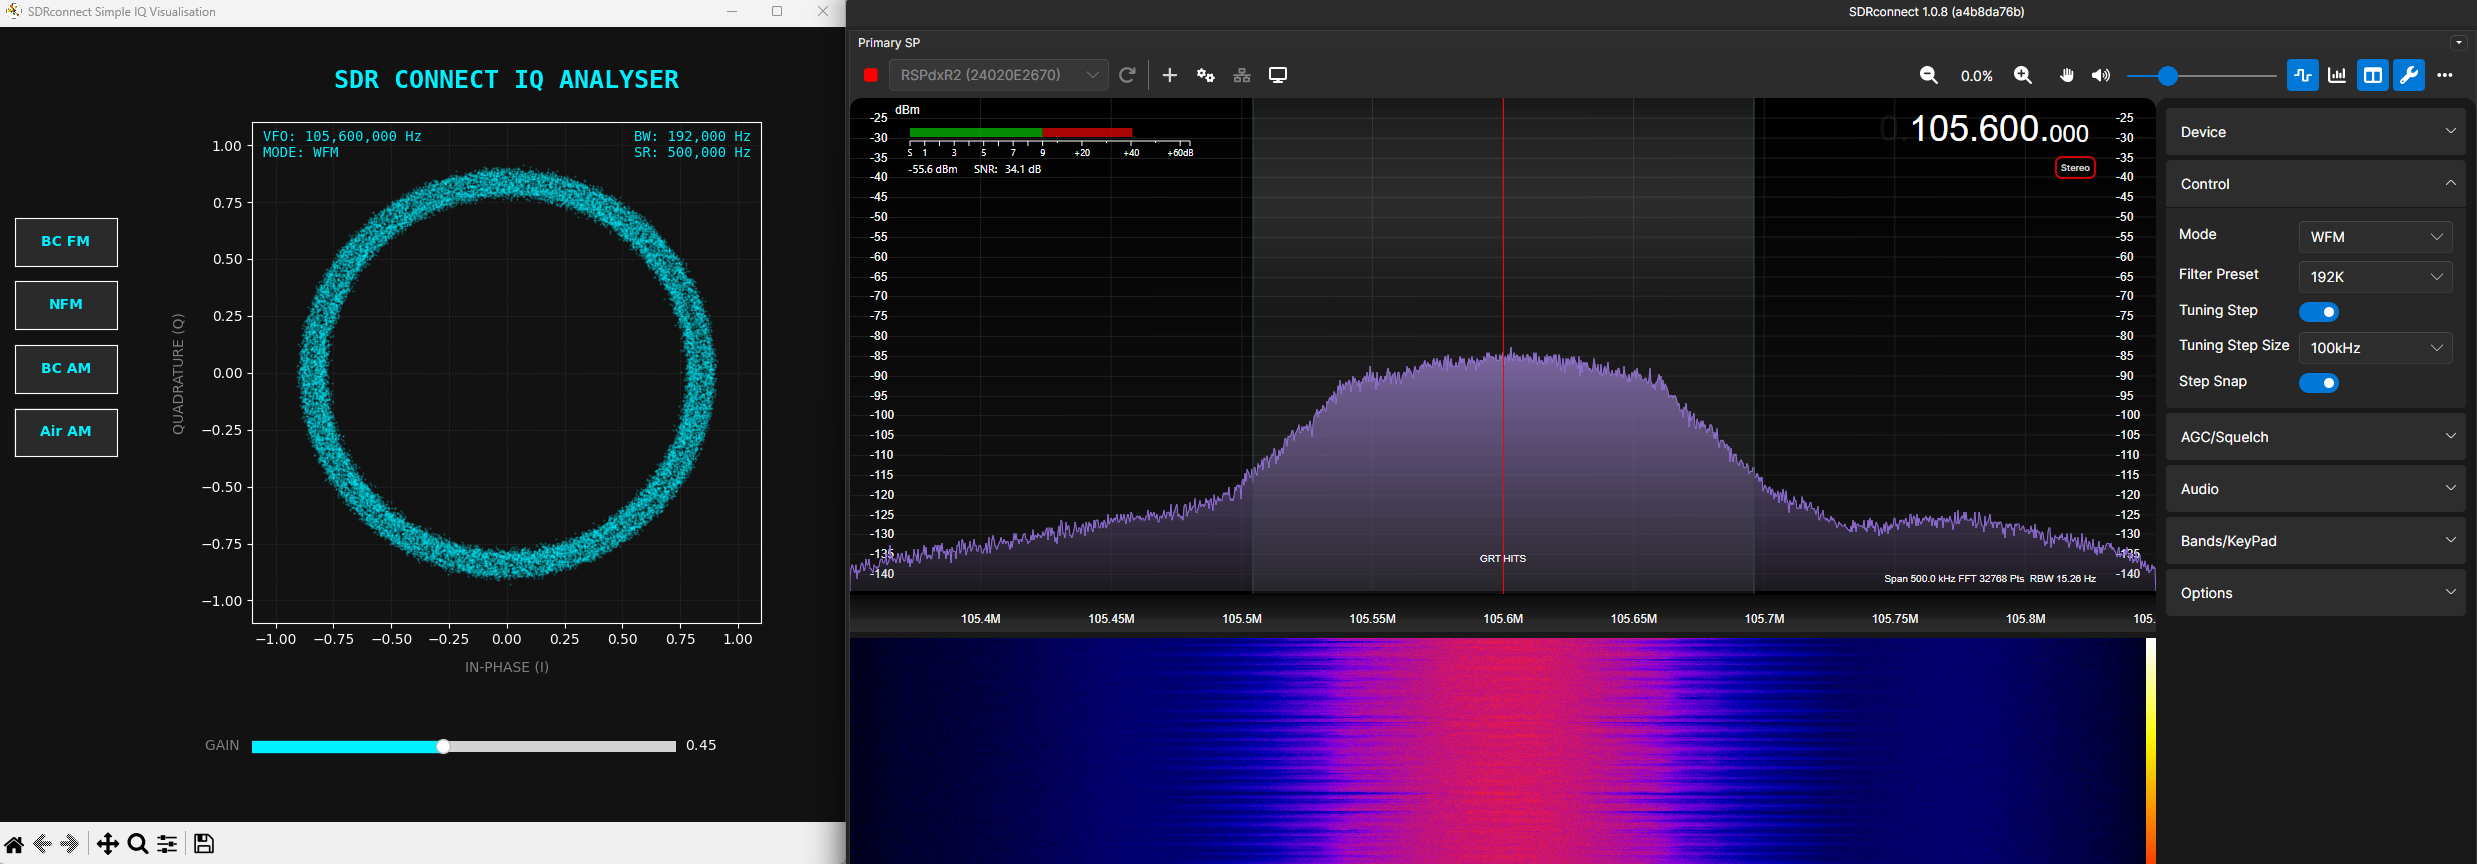
The visualiser has two main controls:
Gain Slider: This rescales the IQ values on the plot (acting as a “zoom” for the constellation) without affecting the actual receiver gain.
Preset Buttons: Quickly set Mode, audio bandwidth, and sample rate for Broadcast FM, Narrowband FM, Broadcast AM, and Airband.
You can still adjust settings directly in SDRconnect and see the changes reflected in the plot. Note that because the IQ data is centered on the window rather than the VFO line, the script “jumps” the window occasionally to keep your signal centered. This is a workaround for SDRconnect’s current tuning implementation but works well for most use cases.
I built this tool in an afternoon to give newcomers an easy starting point—enjoy exploring the signals!